Multi-hazard risk analysis of Burundi
Risks and resilience
Multi-hazard risk analysis of Burundi
Floods, torrential rain, strong winds, earthquakes and landslides: what the first national risk mapping says about the country, where the losses are concentrated, and the corrective actions it recommends.
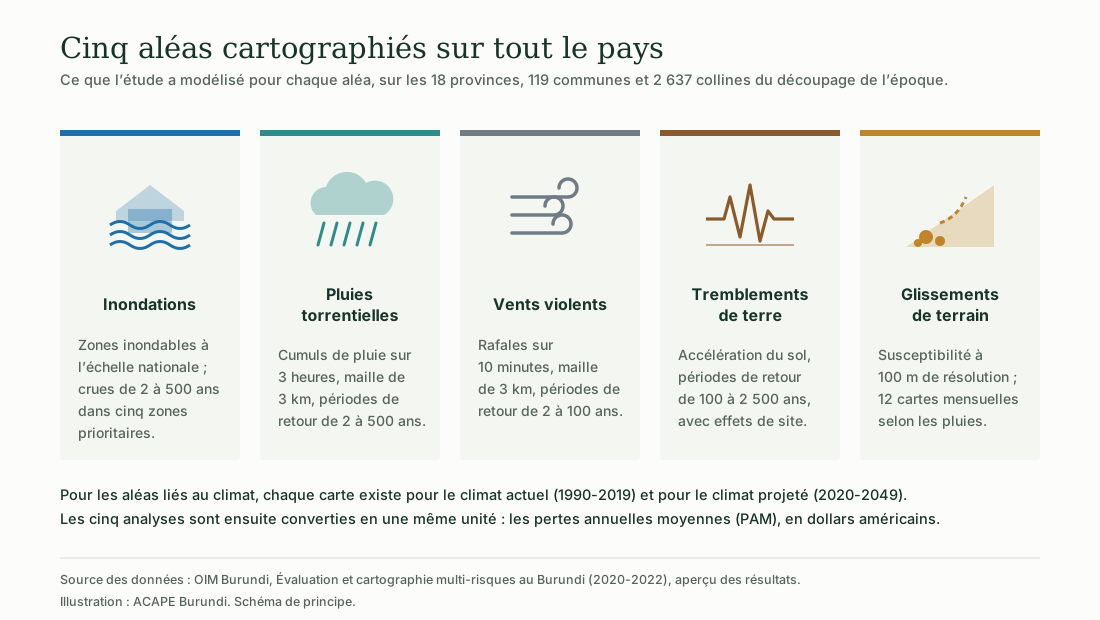
Illustration: ACAPE Burundi. Data: IOM Burundi, Multi-hazard risk assessment and mapping in Burundi (2020-2022), summary of results.
Every figure comes from the multi-hazard risk assessment and mapping carried out for the International Organization for Migration (IOM) in Burundi, funded by the European Union, and published on the national online risk platform. They are model projections: the authors present them as orders of magnitude, without any estimate of uncertainty.
The study uses the administrative division of the time — 18 provinces, 119 communes, 2,637 collines (hills) — which predates the 2025 territorial reform. The province and commune names are therefore those of the study.
The illustrations were drawn for this page by ACAPE Burundi from these data. They are schematic: none of them is an official map. The study’s four official maps, reproduced from the national risk platform, are credited to IOM Burundi beneath each one.
The study was carried out from mid-August 2020 to December 2021 by a consortium coordinated by IDOM, with EURAC Research, Meteosim, the GIIS-Geolyder group and the Burundian association APRN, assisted by Ramboll. It forms the first component of the TUBEHONEZA project for strengthening resilience to natural disaster risks; the next two concern strengthening the capacities of communities and institutions, and then risk mitigation.
Why it matters
Four markers to measure what is at stake
The first two come from IOM’s presentation sheet; the next two from the records of IOM’s Displacement Tracking Matrix (DTM) for 2018-2021, cited by the study.
More than 90%
of population displacement in Burundi is caused by climate-related disasters.
Among the 20 countries
most vulnerable to climate change in the world, according to IOM.
About 215,000
people affected between 2018 and 2021, including nearly 80,000 displaced, and about 130 victims or missing persons.
About 9,500 houses
totally or partly destroyed over the same period, and more than 40,000 houses affected.
The method
From the phenomenon to the loss: four steps
The maps were produced at four levels. Each step answers a simple question.
The hazard
Where, how often and how intensely can the phenomenon occur, in the current climate and in the projected climate?
Exposure
What lies in its path? Houses classified by type of construction, the population, roads and bridges, schools, health centres, the power network and protected areas.
Vulnerability
Who has the fewest means to cope and recover? An index of 3 categories, 11 components and 40 indicators, calculated from 111 variables.
Risk
How much do disasters cost, on average, each year? These are the average annual losses (AAL), which add up small frequent events and large rare ones.
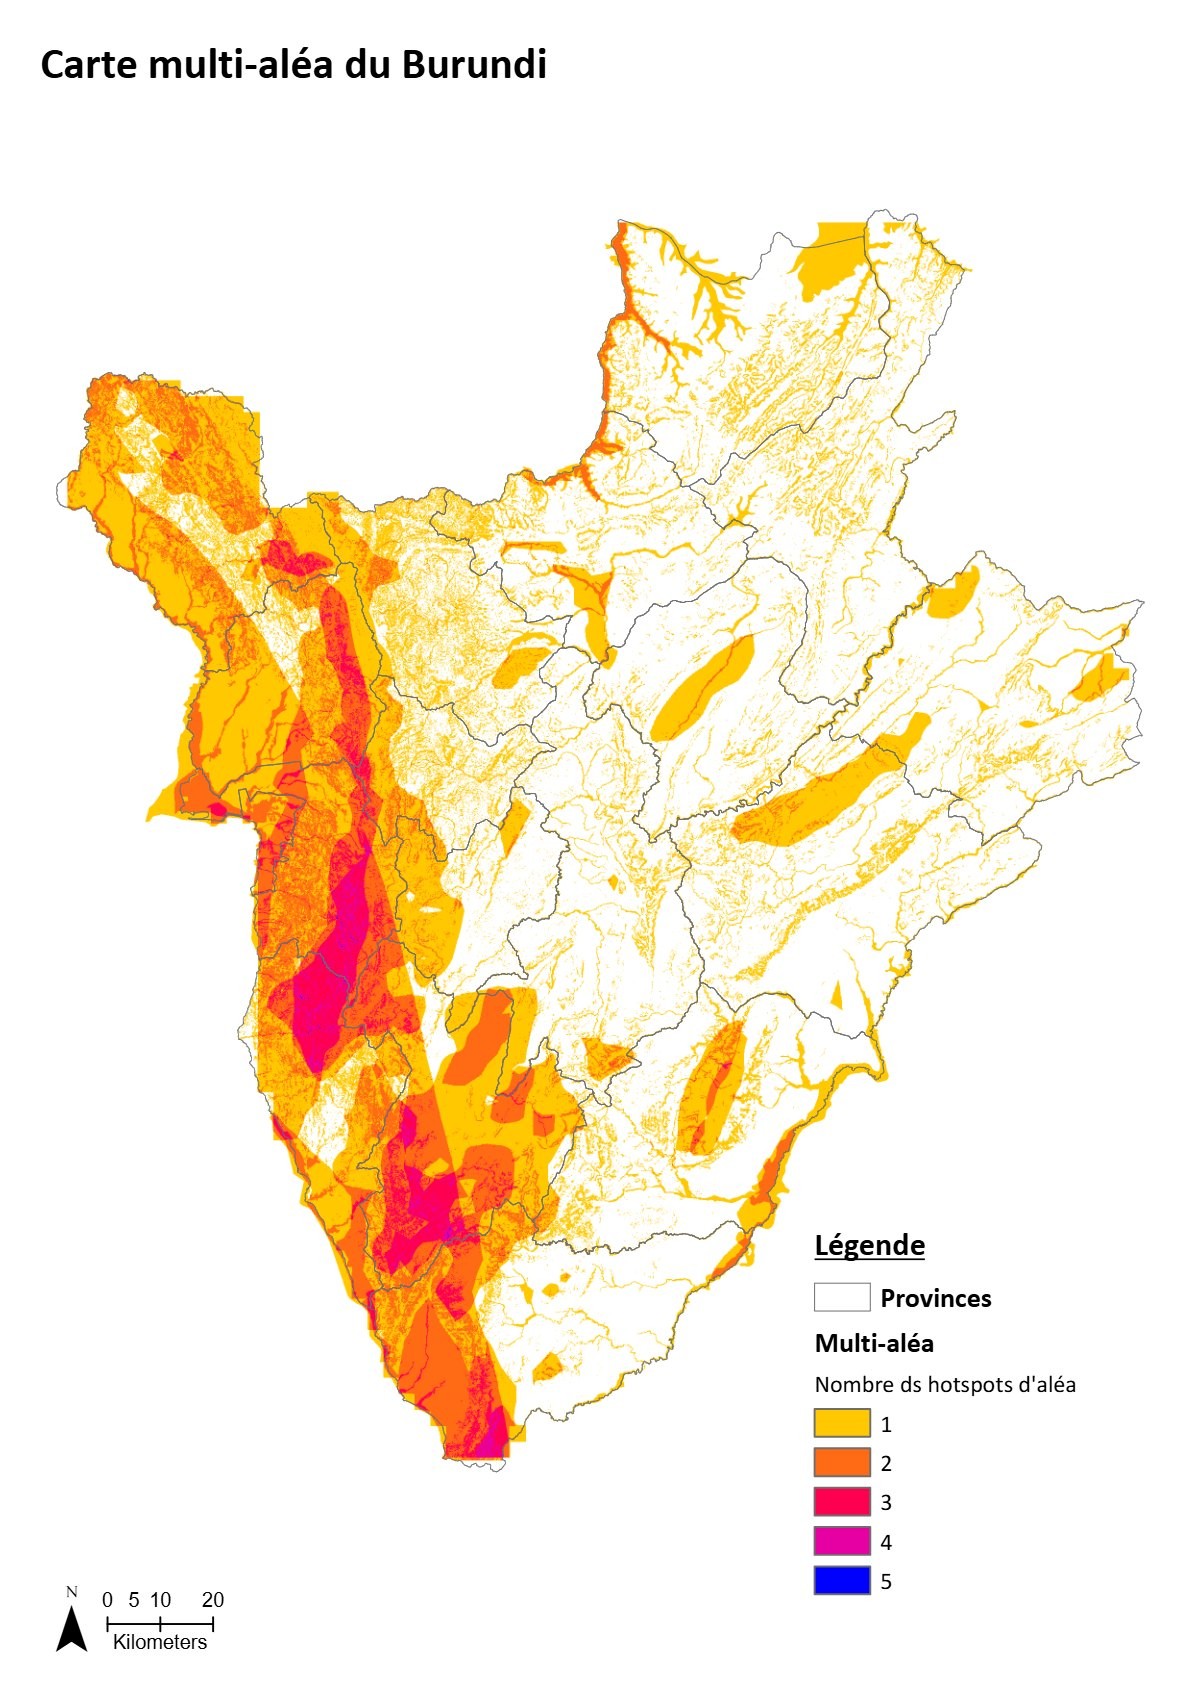
Multi-hazard map: the darker the colour, the more hazards overlap. The west of the country concentrates the most exposed areas. Credit: IOM Burundi, Multi-hazard risk assessment and mapping in Burundi (2020-2022), IDOM consortium, funded by the European Union.
What the study produced
126 risk maps at provincial level (one per hazard and per province), 6 national maps (one per hazard and one multi-hazard map), a risk atlas, a summary of results, an assessment of disaster risk needs and an online platform.
Five priority areas were analysed in greater detail: Bujumbura Mairie, Gitega, Rugombo (Cibitoke), Ngozi and Bukemba (Rutana).
Vulnerability relies on the 2020 DTM survey carried out on 532 collines, that is 20% of the total. Its main lesson: vulnerability is highly localised and can vary greatly between communities that are nonetheless neighbours. No area is the most vulnerable on every aspect at once.
What disasters cost
Nearly 93 million dollars a year
All causes combined, the study puts average annual losses at 92.75 million dollars, about 3.1% of 2019 gross domestic product. According to the authors, this order of magnitude is common in countries exposed to natural disasters.
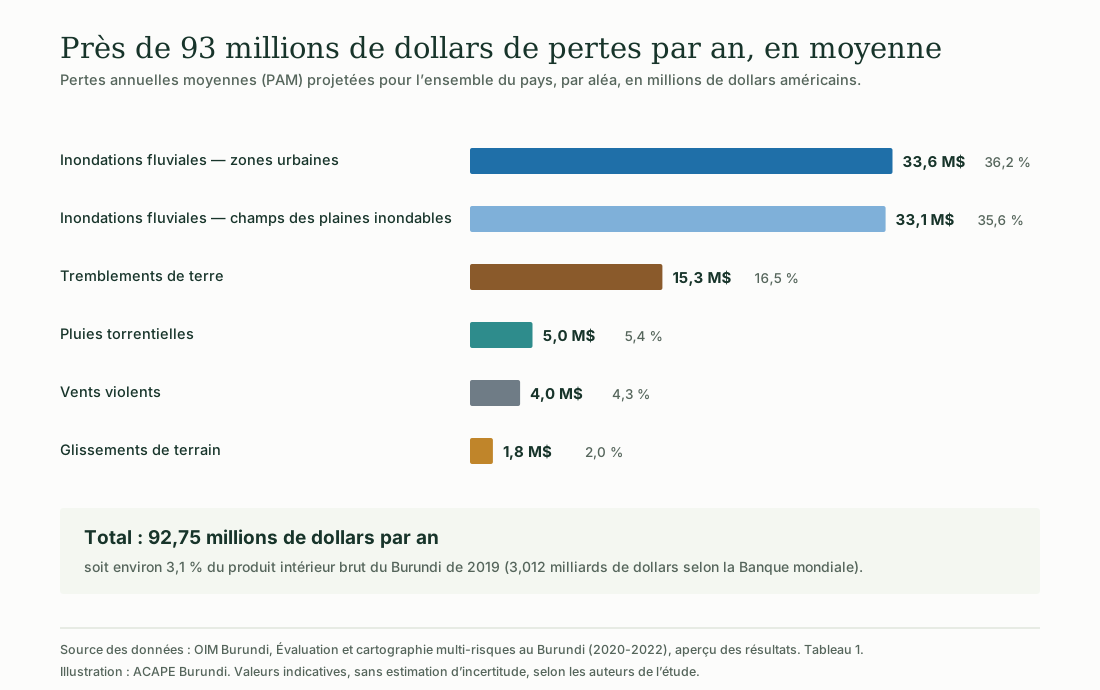
Illustration: ACAPE Burundi. Data: IOM Burundi, Multi-hazard risk assessment and mapping in Burundi (2020-2022), table 1.
River floods alone account for more than 70% of losses: half in towns, half in the fields of the floodplains. Earthquakes come next, with 15.3 million dollars, more than a third of it in Bujumbura Mairie.
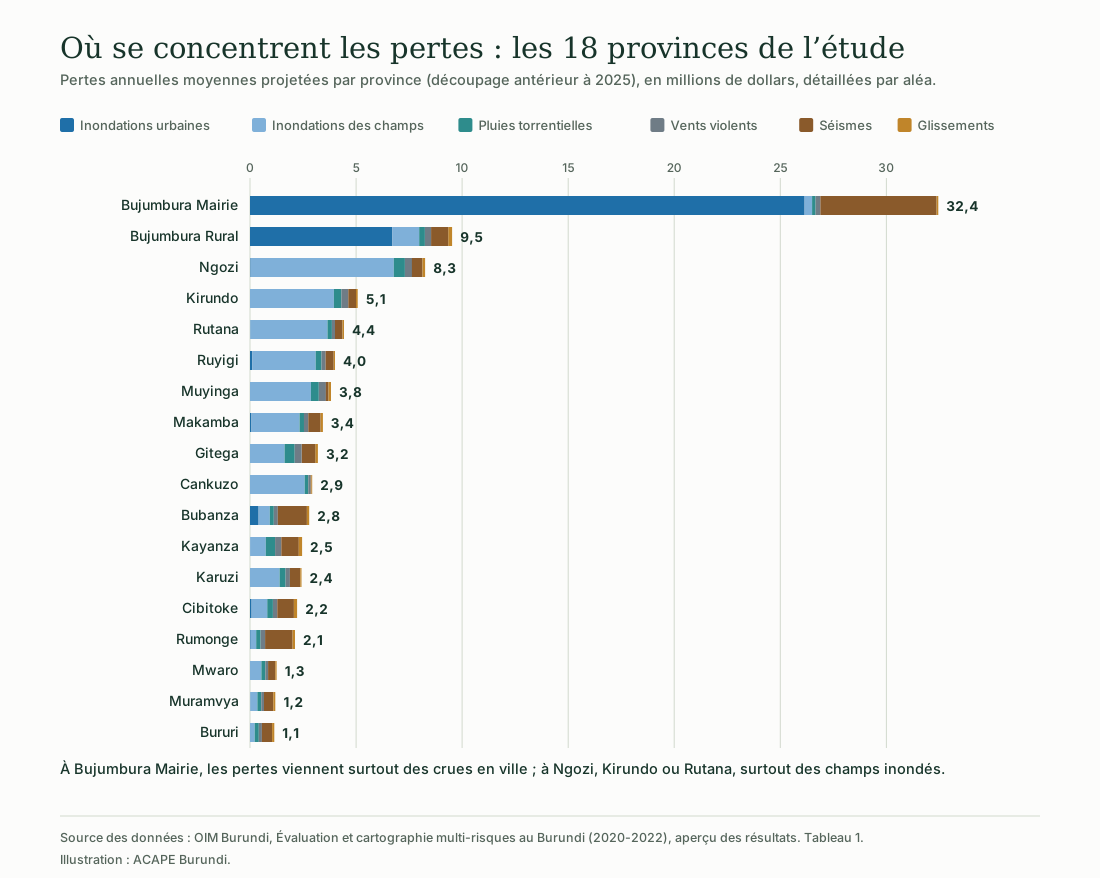
Illustration: ACAPE Burundi. Data: IOM Burundi, Multi-hazard risk assessment and mapping in Burundi (2020-2022), table 1.
Should flooded fields be counted?
In Ngozi, 6.75 million dollars out of 8.26 come from crops in the floodplains. The authors point out that in many countries periodic floods on agricultural plains are accepted as a natural fact by those who farm this land.
In Burundi, however, many rural households have no other livelihood. The authors leave it to the national authorities to decide, and recommend reserving protective works on these plains for exceptional cases, justified by a cost-benefit analysis.
Where risk is concentrated
The most exposed communes
To compare communes of different sizes, the study divides average annual losses by the area of each commune.
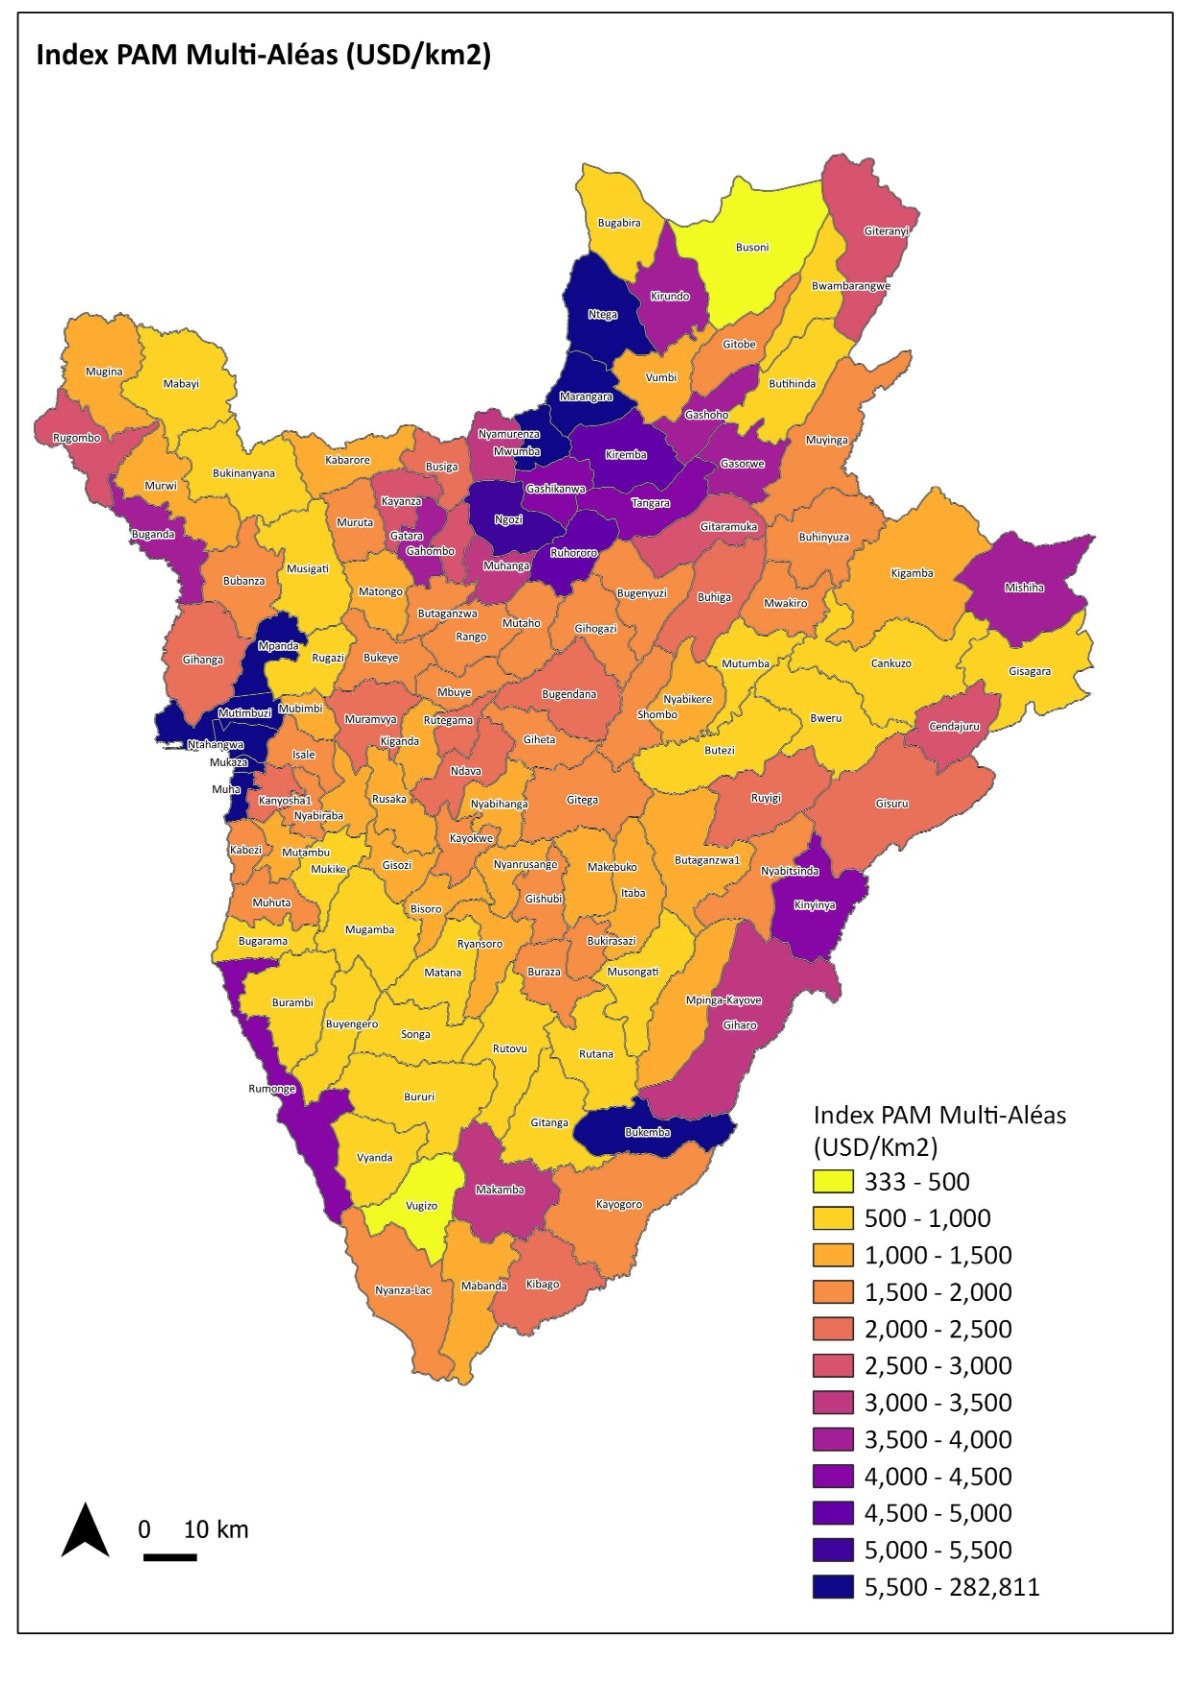
All communes, from the least exposed (yellow) to the most exposed (dark blue), by average annual losses per km². Credit: IOM Burundi, Multi-hazard risk assessment and mapping in Burundi (2020-2022), IDOM consortium, funded by the European Union.
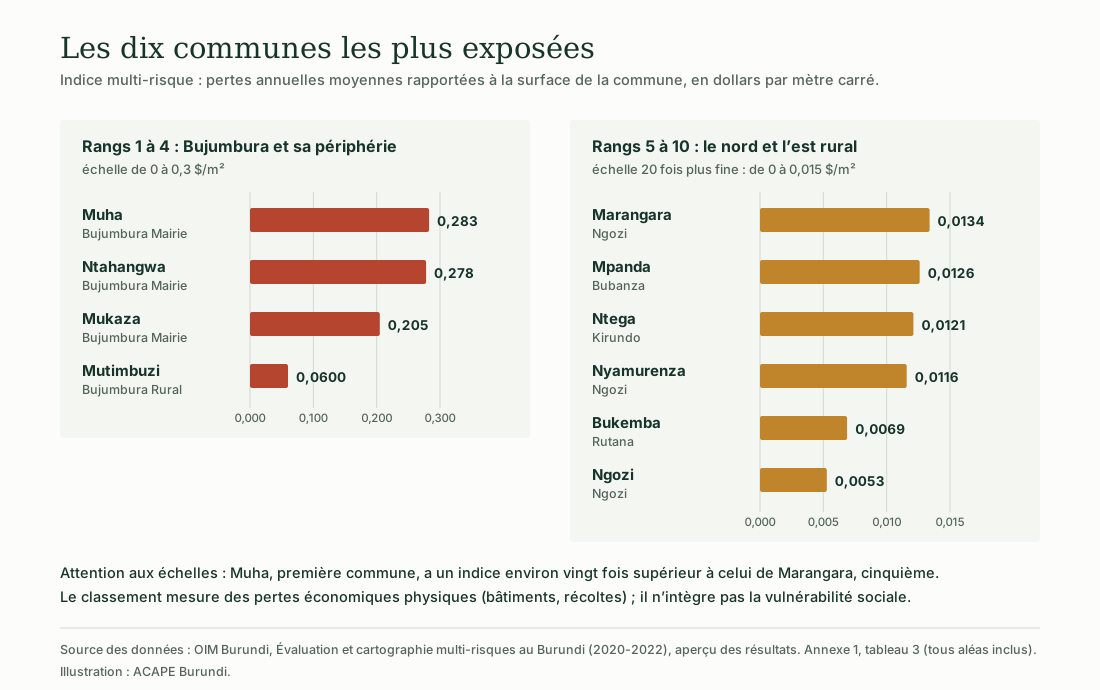
Illustration: ACAPE Burundi. Data: IOM Burundi, Multi-hazard risk assessment and mapping in Burundi (2020-2022), annex 1, table 3.
These ten communes are spread across six provinces: Bujumbura Mairie, Bujumbura Rural, Ngozi, Bubanza, Kirundo and Rutana. The ranking only measures material losses — destroyed houses, lost harvests — and not people’s vulnerability.
The second ranking, without flooded fields
When agricultural losses in the floodplains are removed, the communes of the north and east drop back and the west stands out. The top ten become: Muha, Ntahangwa, Mukaza, Mutimbuzi, Mpanda, Rumonge, Kanyosha, Gatara, Kayanza and Muhuta.
The authors consider this second ranking more consistent with the hazard map, and invite national experts to choose the method most useful for the future national risk management strategy.
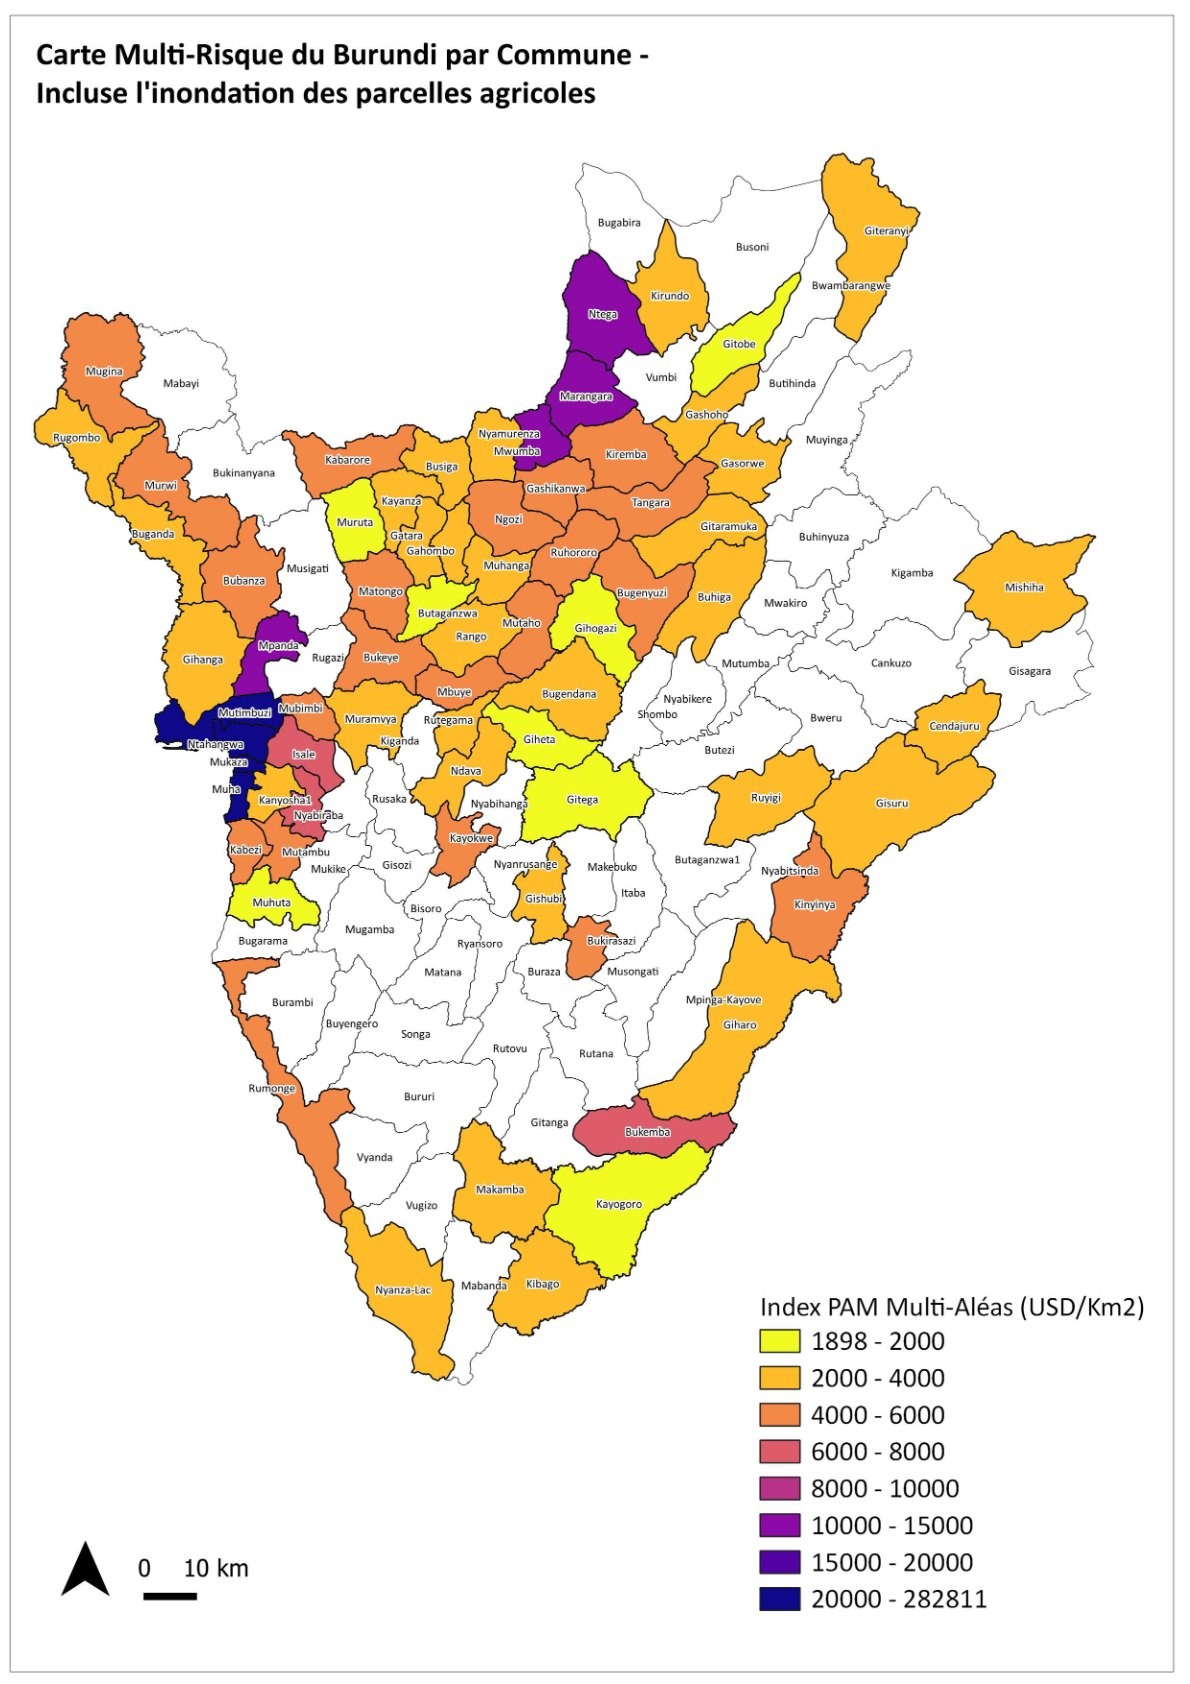
First ranking: all hazards included. The north and east stand out, because of flooded fields. Credit: IOM Burundi, Multi-hazard risk assessment and mapping in Burundi (2020-2022), IDOM consortium, funded by the European Union.
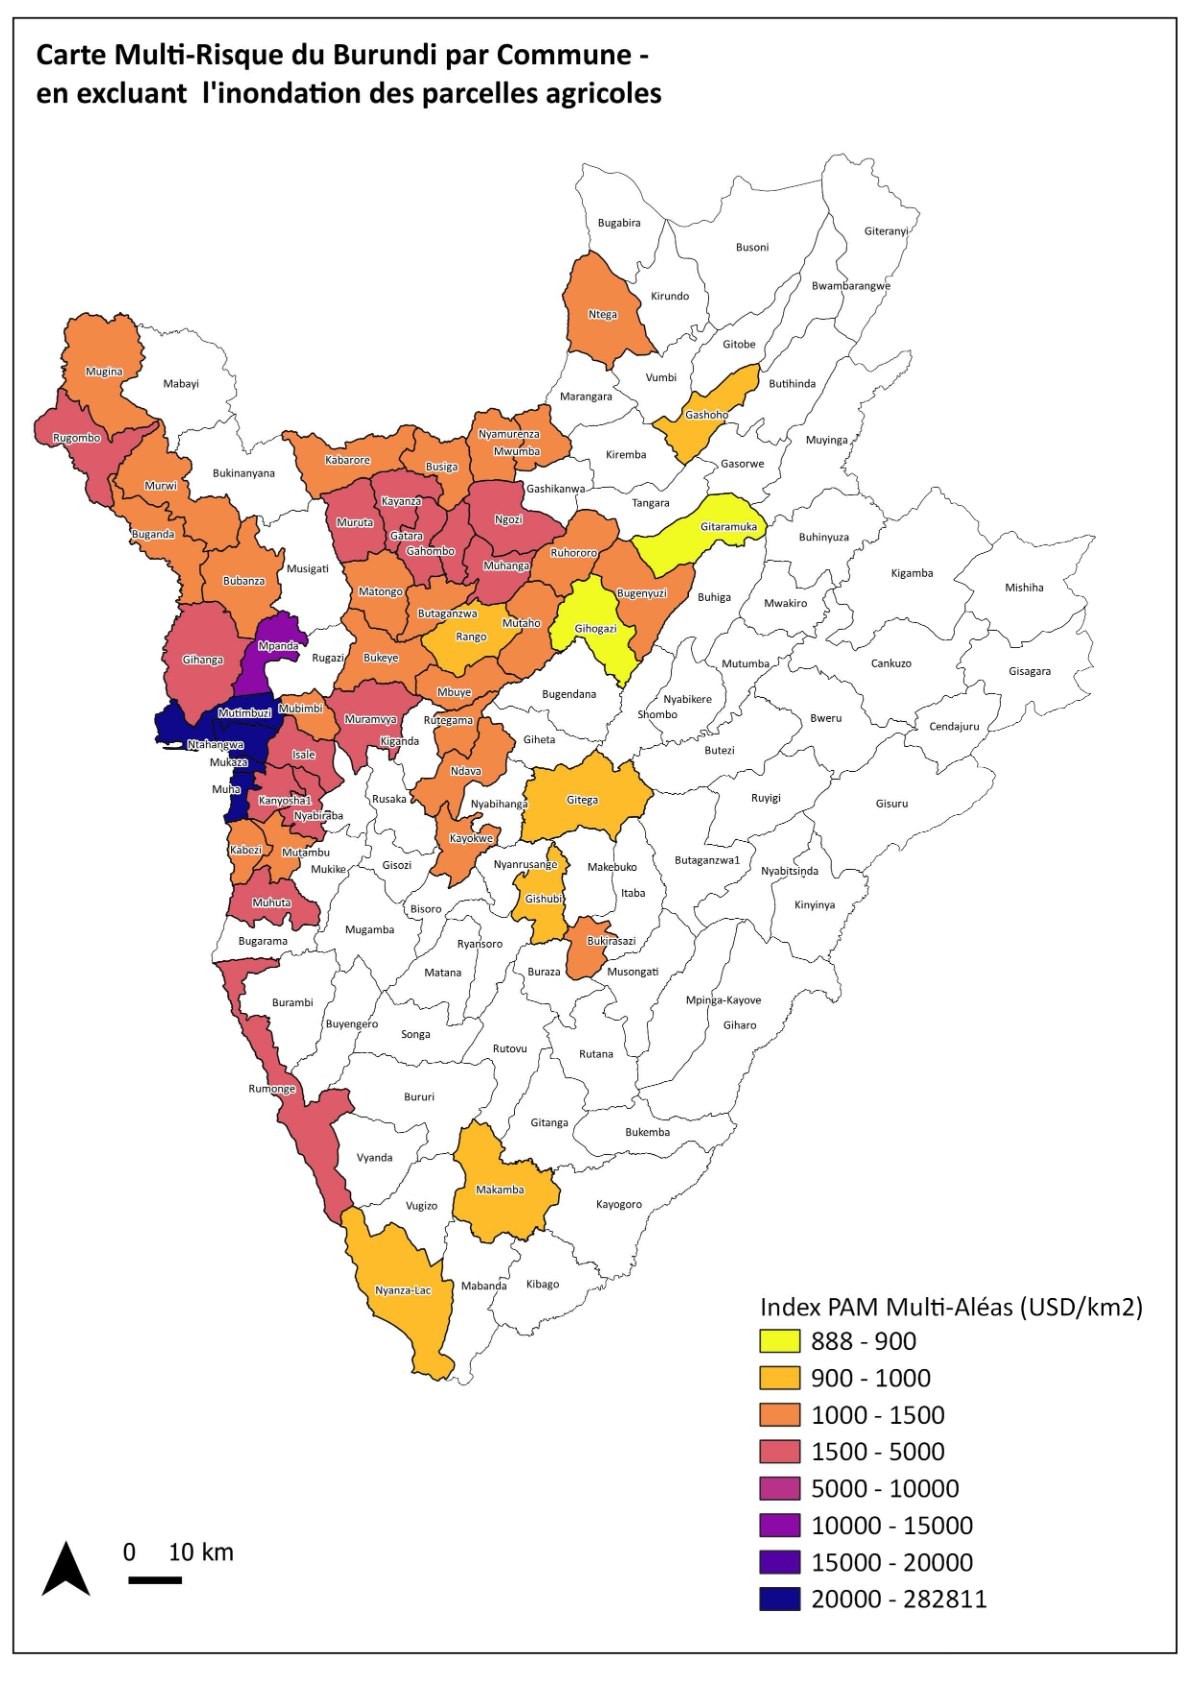
Second ranking: without flooded fields. The west, along the lake and the Imbo plain, takes over. Credit: IOM Burundi, Multi-hazard risk assessment and mapping in Burundi (2020-2022), IDOM consortium, funded by the European Union.
The climate ahead
More concentrated rainfall by 2050
Projections from three climate models at 3 km resolution, for 2020-2049 compared with 1990-2019.
+0.2 to +3 mm a day
Increase in average daily rainfall, mainly during the rainy season.
+25 to +40%
The largest relative increases in the country. The dry eastern plateaux also see large increases.
+6 to +14%
Of cumulative rainfall on wet and very wet days, and +4 to +10% on extremely wet days, notably in Bujumbura, Bubanza, Kirundo and Ruyigi: more intense rain, concentrated on fewer days.
Little change
On gusty days, wind speed stays close to today’s, with a slight downward trend.
The simulations use the RCP8.5 scenario, which assumes no emission-reduction policies. The authors justify this choice by the small difference between scenarios over a thirty-year horizon.
A risk of its own
The rising waters of Lake Tanganyika
Among the towns on the Burundian shore, only Bujumbura and Rumonge see the water reach urban areas.
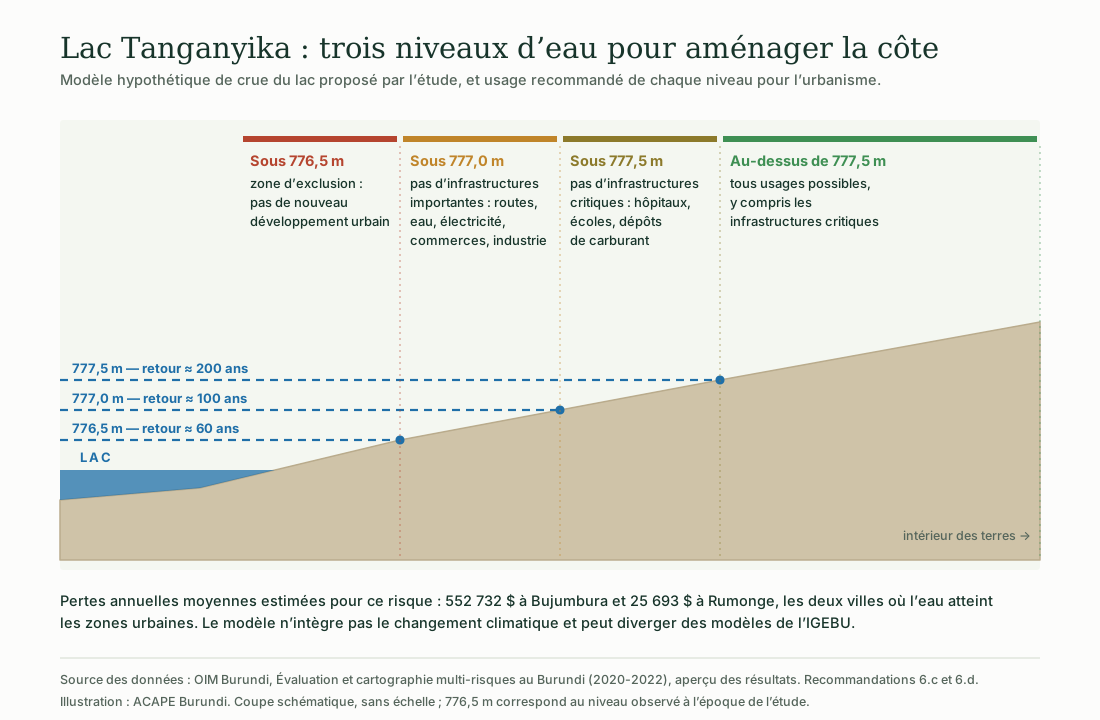
Illustration: ACAPE Burundi. Data: IOM Burundi, Multi-hazard risk assessment and mapping in Burundi (2020-2022), recommendations 6.c and 6.d.
The model is hypothetical: lake-level records are scarce and sometimes contradictory, and the level depends mainly on what happens across the whole basin, shared with neighbouring countries. These losses are not added to those of river floods, whose dynamics are different.
Corrective actions to take
What the study recommends
The recommendations are designed for a country with limited resources, where simple procedures run by trained staff can be more effective than costly tools.
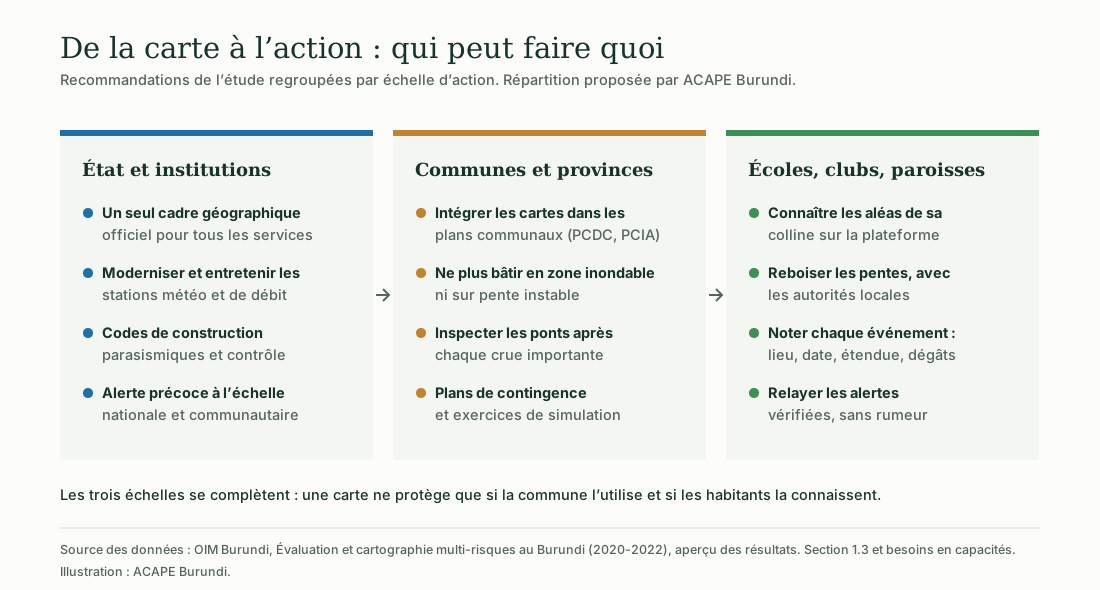
Illustration: ACAPE Burundi. Grouping proposed by ACAPE Burundi from the study’s recommendations (section 1.3) and capacity needs.
Eight cross-cutting priorities
1. A common geographical framework. Agree on a reference geographical framework — official names and boundaries, from collines to provinces — used by every department, and update the baseline data: boundaries, roads, built-up areas, rivers, farmland.
2. Better recording of disasters. Systematise the approach begun by the DTM in 2018: for each event, record the georeferenced location, the extent of the affected area, the intensity of the phenomenon and the damage by building type.
3. Better measuring equipment. Modernise the network of weather stations and river-flow stations, with effective maintenance programmes.
4. Planning towns and countryside. Consistent urban and rural planning is essential to avoid an uncontrolled rise in risk. It may include moving vulnerable households living in flood zones or along overflowing urban ravines to new neighbourhoods.
5. Mitigation with nature. Favour nature-based solutions, such as reforestation against landslides, involving communities in the conservation and use of the forests created.
6. Checking that each structure is worth it. Base every protective work on a sound cost-benefit analysis that validates both the investment and the risk reduction achieved.
7. Build back better. Rebuild houses and infrastructure with better materials and structures, as a priority for the most vulnerable communities who cannot be relocated.
8. Refining the values used. Have a wider group of experts review the building replacement costs and floodplain crop values used in the models.
River floods
Have local civil protection review, commune by commune, the flood zones drawn from the national map, then update the map with each new event.
Improve the management of the catchments of flood-prone rivers.
Improve local maps — geology, land use, aerial photographs — and recover the original course of streams diverted by urbanisation, an observed cause of serious damage in Bujumbura.
Extend the hydrological modelling carried out in the priority areas to other problem rivers.
Inspect bridges after every major flood: scouring at the foot of the piers, slips on the banks.
Install early-warning mechanisms along rivers, with automatic or manual gauging stations.
Torrential rain
Update the model with detailed event records, and use existing automatic rainfall records to better understand the rains that cause damage.
Encourage the resettlement of vulnerable households living along overflowing ravines or in flat areas where water accumulates.
Set up warning systems to evacuate vulnerable residents in time, and build collective shelters in strategic locations.
Strong winds
Also apply most of the measures planned for torrential rain.
Help people build back better, especially households who cannot afford a wind-resistant roof.
Study the value of traditional fired-clay tiles, more common in the mountainous centre than along the lake, for better resistance to strong winds.
Earthquakes
Adopt earthquake-resistant building codes and enforce them.
Reduce self-building: adobe and unreinforced masonry are highly vulnerable and should be strengthened, with support from trained specialists to check designs and supervise building sites.
Inventory and strengthen critical infrastructure: roads, bridges, dams, water, electricity.
Update geological maps, study active faults and carry out microzoning studies in the west of the country, where soft soils predominate.
Use the results for contingency plans and urban planning, and avoid building in high seismic-risk zones.
Landslides
Limit urban development in areas highly susceptible to landslides and avoid any new housing there.
Coordinate river management to take bank erosion into account.
Limit uncontrolled deforestation and land use; reforest or plant crops that hold the soil.
Take risk zones into account when building and maintaining roads and bridges.
Lake Tanganyika
Clarify the gap between the flooded areas observed in Bujumbura and IGEBU’s models, check the gauge at Bujumbura port and install equivalent devices in other shoreline towns.
Review shoreline planning according to the three water levels, and revise plans as knowledge of the lake improves.
In the short term, assist affected households, including by relocation from the most exposed areas.
In the highest-risk areas, consider dykes, vegetation barriers or raised buildings, after technical, social and cost-benefit studies, while preserving the lake’s ecological balance.
Cooperate with the other lakeshore countries to understand the lake’s behaviour and build long-term joint solutions.
Needs expressed by actors on the ground
Information. Commune and provincial planning documents (PCDC, PCIA, SPAT) lack data on land use, hydrology and risk zones. Mapping risk zones would avoid resettling displaced people in other dangerous areas.
Warning and dissemination. An early-warning system at national and community level appears essential. IGEBU, private media and community radio stations need to disseminate information better, with simplified seasonal forecasts accompanied by concrete action messages.
Means. Lack of funding and expertise in communes, lack of protection and drainage works, need to rehearse contingency plans (stressed by the Red Cross), need for vehicles and emergency equipment.
Education. Awareness and education on risk management, and good practice in a crisis, should be spread more widely.
At your level
Learn, act, pass it on
Proposal by ACAPE Burundi for clubs, schools and parishes, drawn from the study’s recommendations.
Know your commune’s hazards
Look up your province’s and commune’s map on the national risk platform: which hazards, and where? Identify with the elders the places that have already flooded or slipped.
Plant and record
Reforest slopes and riverbanks with the agreement of the local authorities and landowners. Keep a register of events — place, date, extent, damage — and hand it to the commune administration.
Relay what is verified
Relay only official warnings and forecasts, at school, at church or on community radio. Hold a discussion based on your commune’s map.
Never go near a river in flood or a bank that has just collapsed to observe or take photographs. Photos of people are taken with their consent, and with their parents’ consent for minors. A warning does not replace the emergency services.
Going further
Using the national risk platform
The study’s maps, layers and reports are freely accessible online.
Open the platform
Go to the address 23.239.19.79, from a computer or a phone.
Create an account to download
To download maps or layers, register with your email address as username, then log in. The address is not encrypted (http): choose a password you use nowhere else.
Browse
The Maps tab lets you explore the maps; the Data tab, the layers and documents. The search bar can be narrowed by keywords, data type and category.
The study’s reports
The summary of results, the final report, the risk atlas, the needs assessment and the preliminary assessment of the rising waters of Lake Tanganyika.
Summary of results on the platform · All documents on the platform
For the course
What this analysis teaches
Proposal by ACAPE Burundi: three ways into the modules of the environmental training course.
Climate change
Rain concentrating on fewer days: a quantified Burundian example of what warming changes.
Reforestation and restoration
Reforestation is the first nature-based solution recommended against landslides.
Practical actions
Keeping a register of events on your colline: a simple action that answers a national recommendation.
Maps: IOM Burundi, reproduced for educational and non-commercial purposes · IOM Burundi, Multi-hazard risk assessment and mapping in Burundi (2020-2022), summary of results, consortium of IDOM, EURAC Research, Meteosim, GIIS-Geolyder, APRN and Ramboll, funded by the European Union, national risk platform, document posted on 21 October 2022 · IOM Burundi and Resilience Programme, factsheet “Multi-hazard mapping in Burundi” · World Bank, Burundi’s 2019 GDP, cited by the study.
See the six illustrations · See the four official maps · All learning resources · Take the environmental training course
The illustrations on this page were produced by ACAPE Burundi from these sources. They may be reused and adapted, provided that ACAPE Burundi and the data sources are cited.