Illustrations — Multi-hazard risk analysis of Burundi
Completion requirements
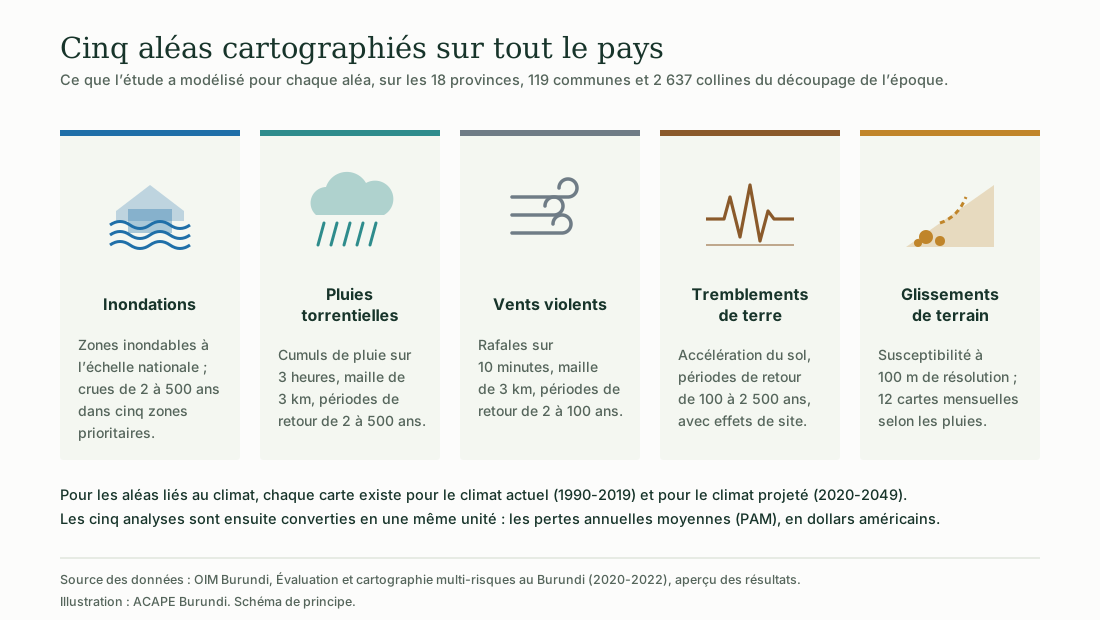
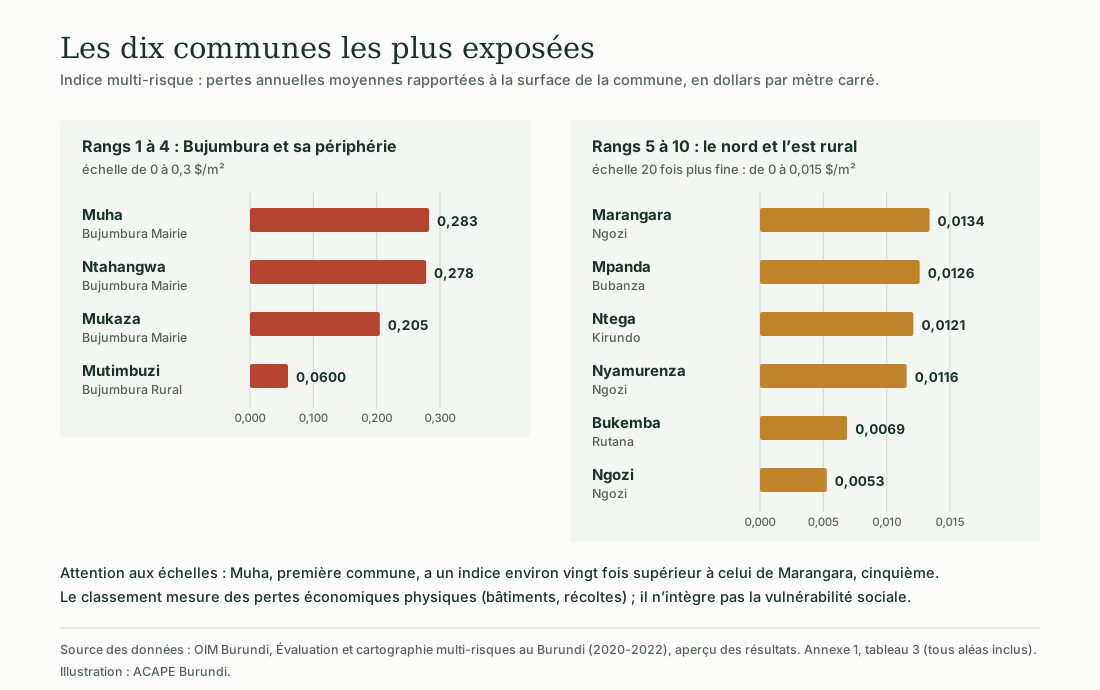
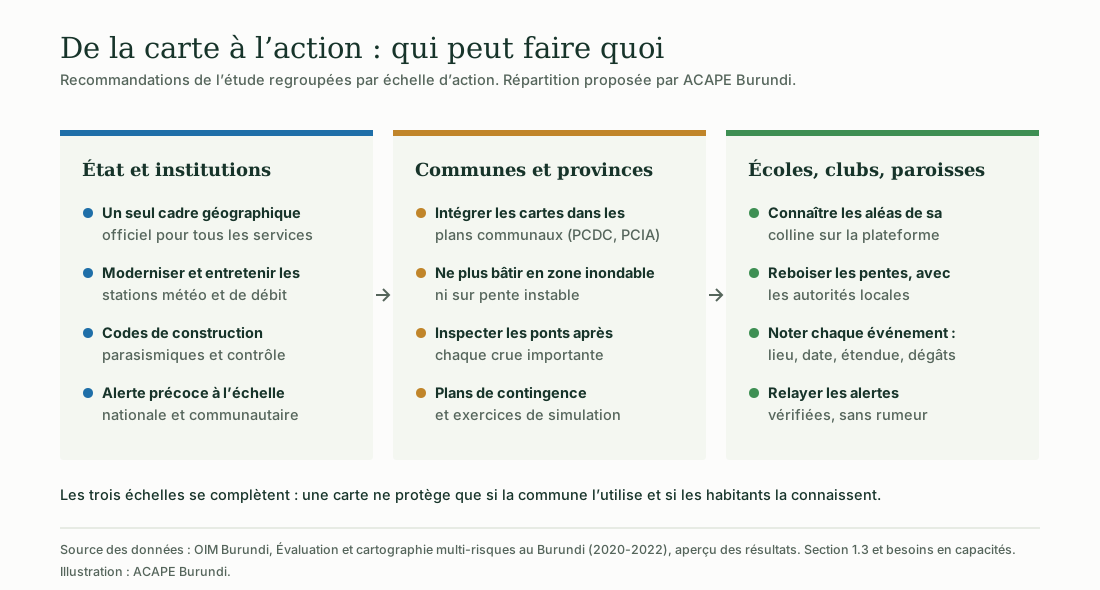
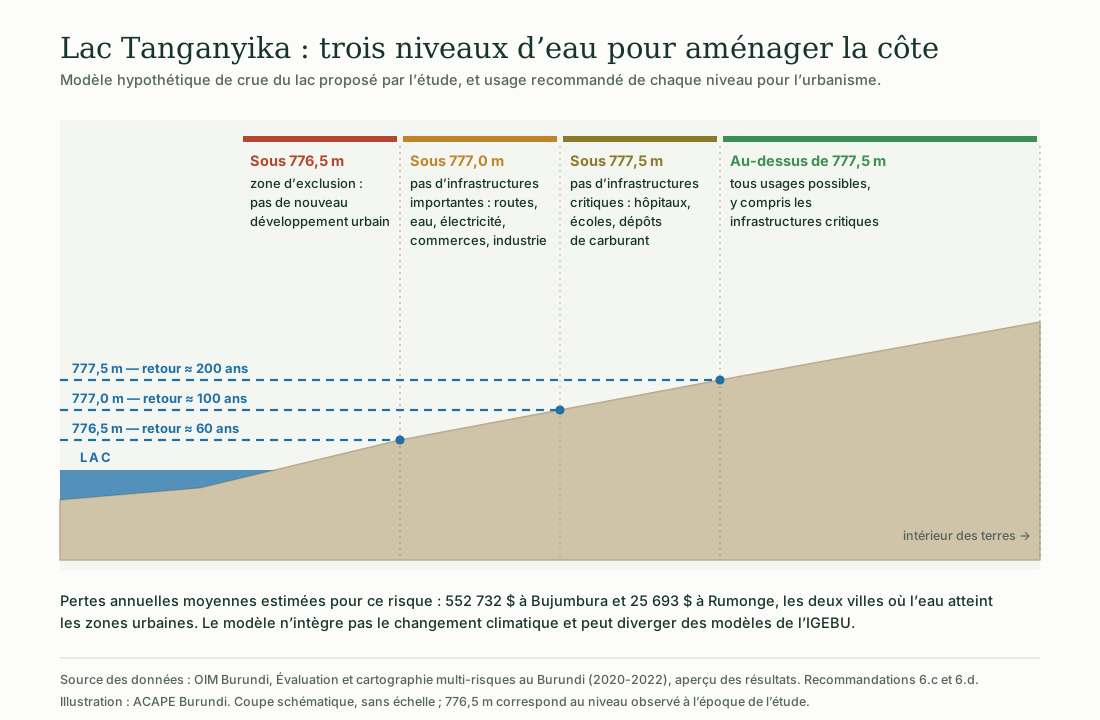
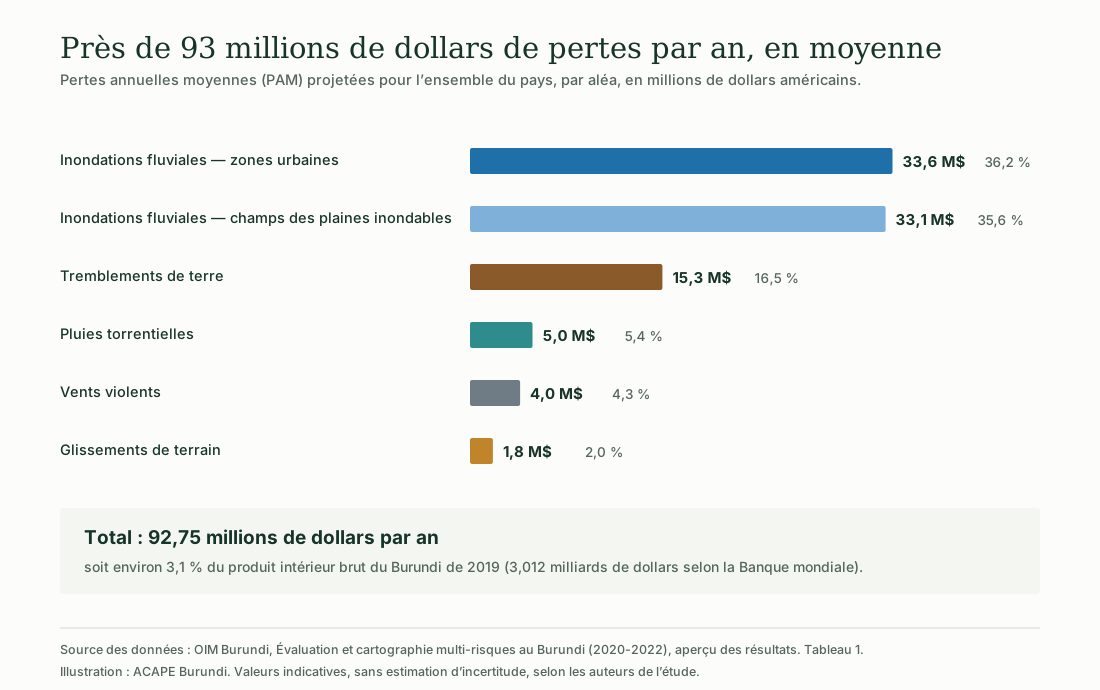
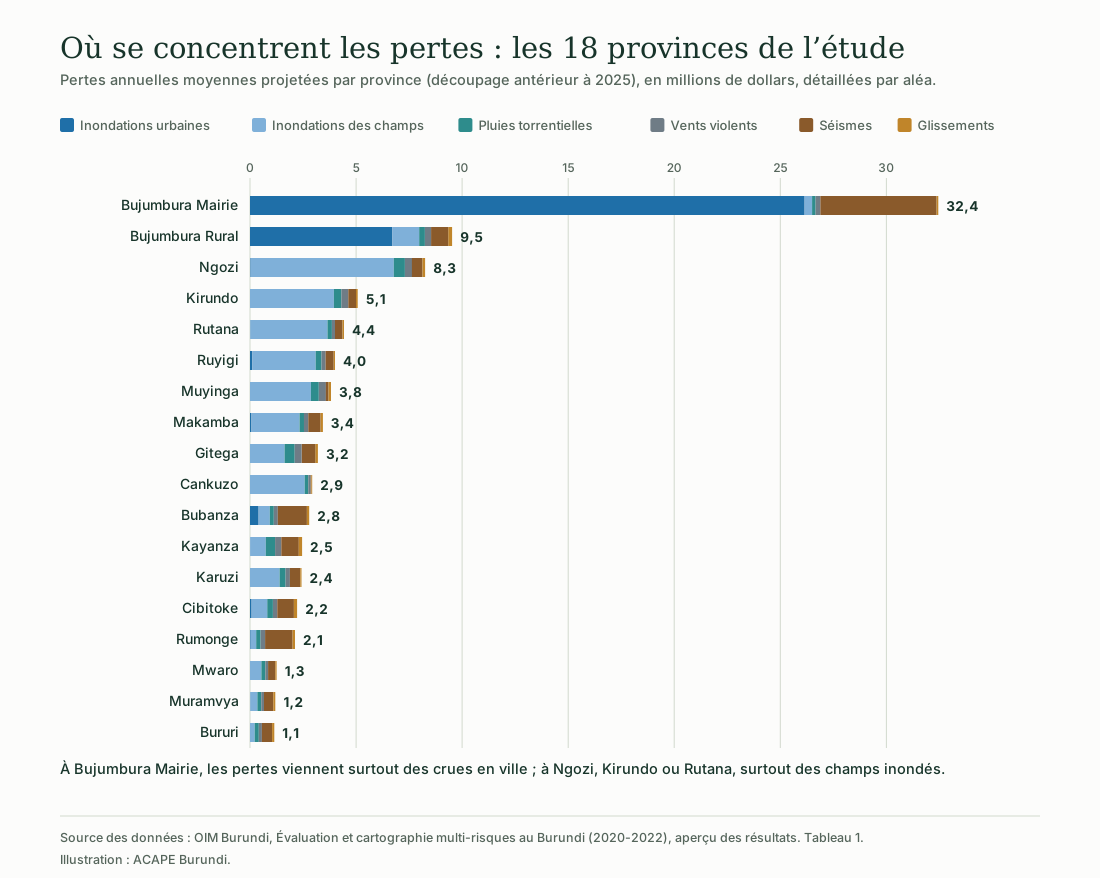
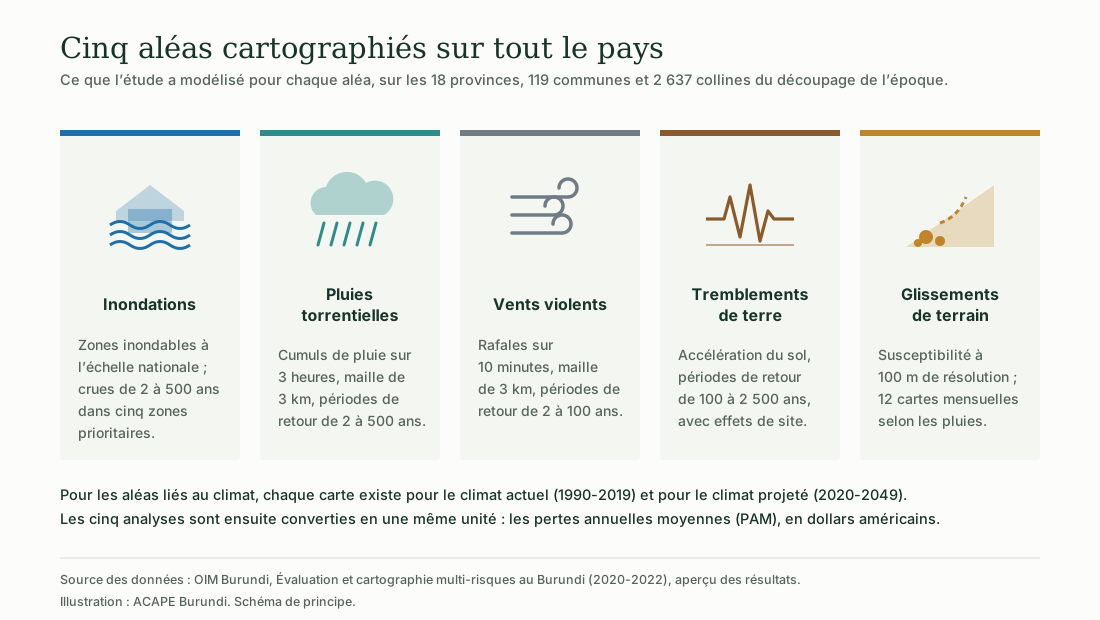
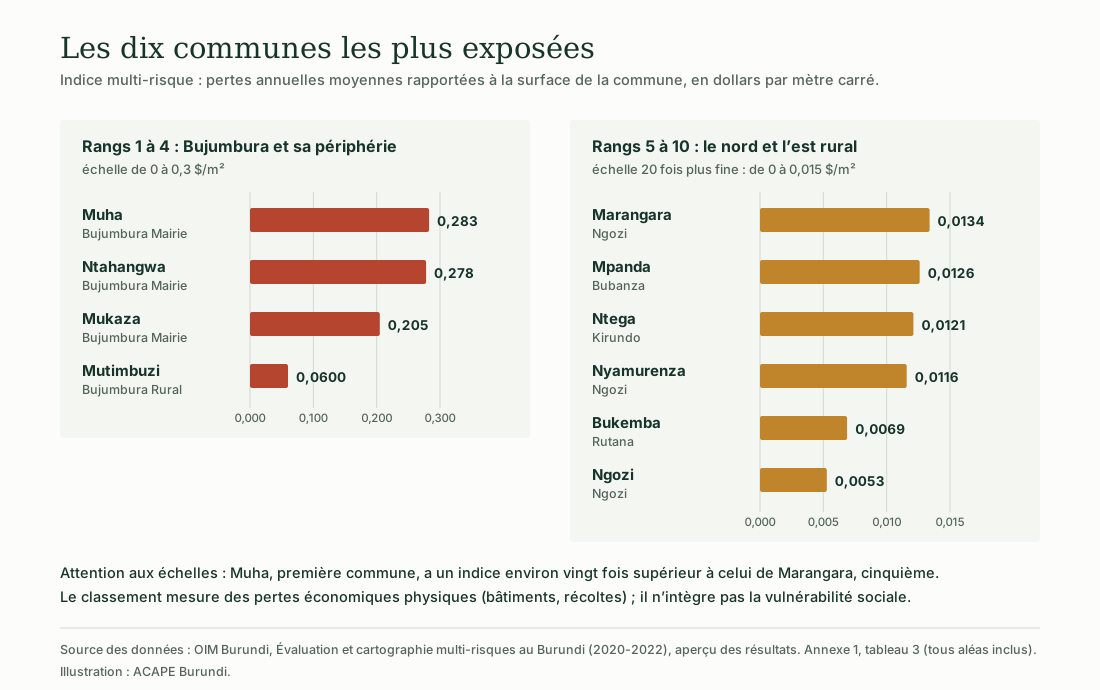
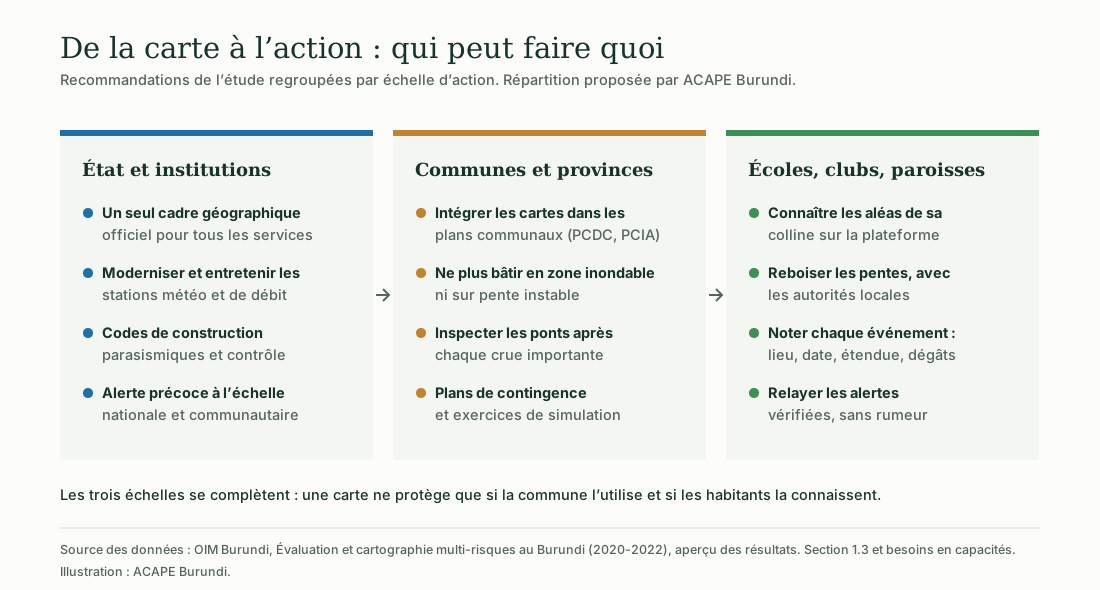
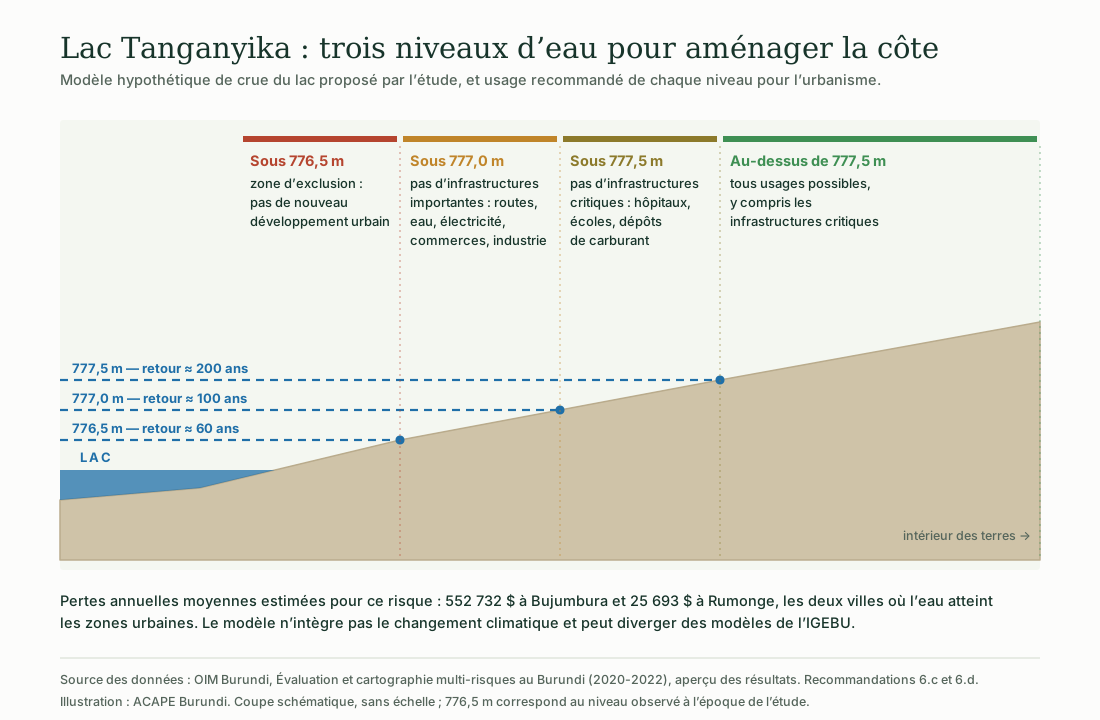
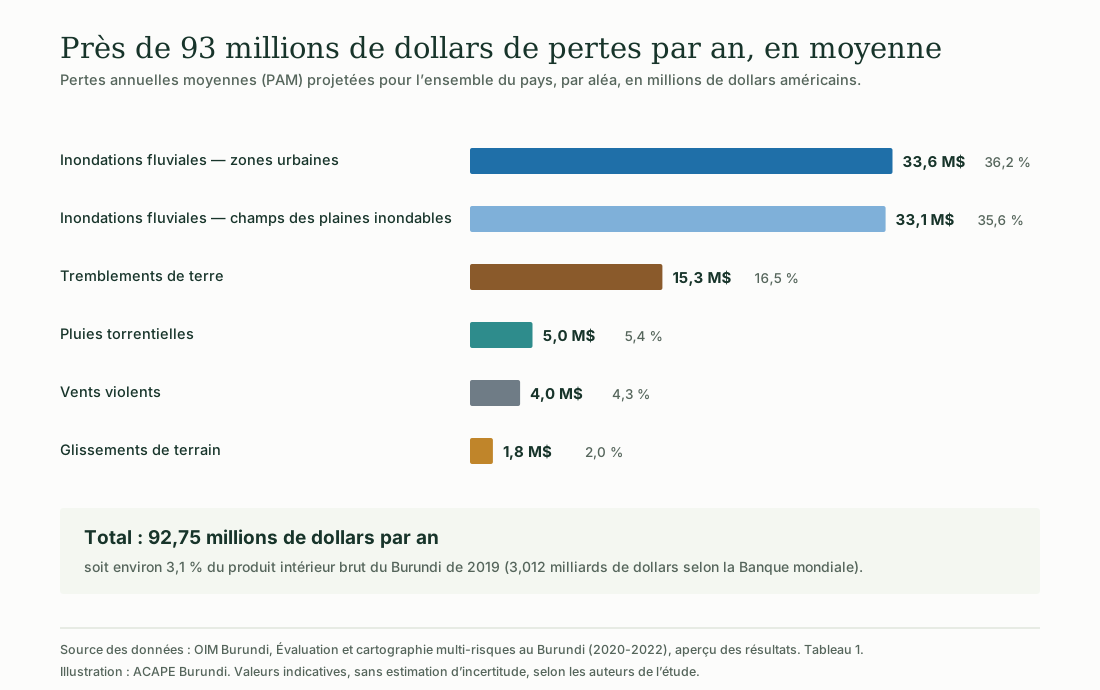
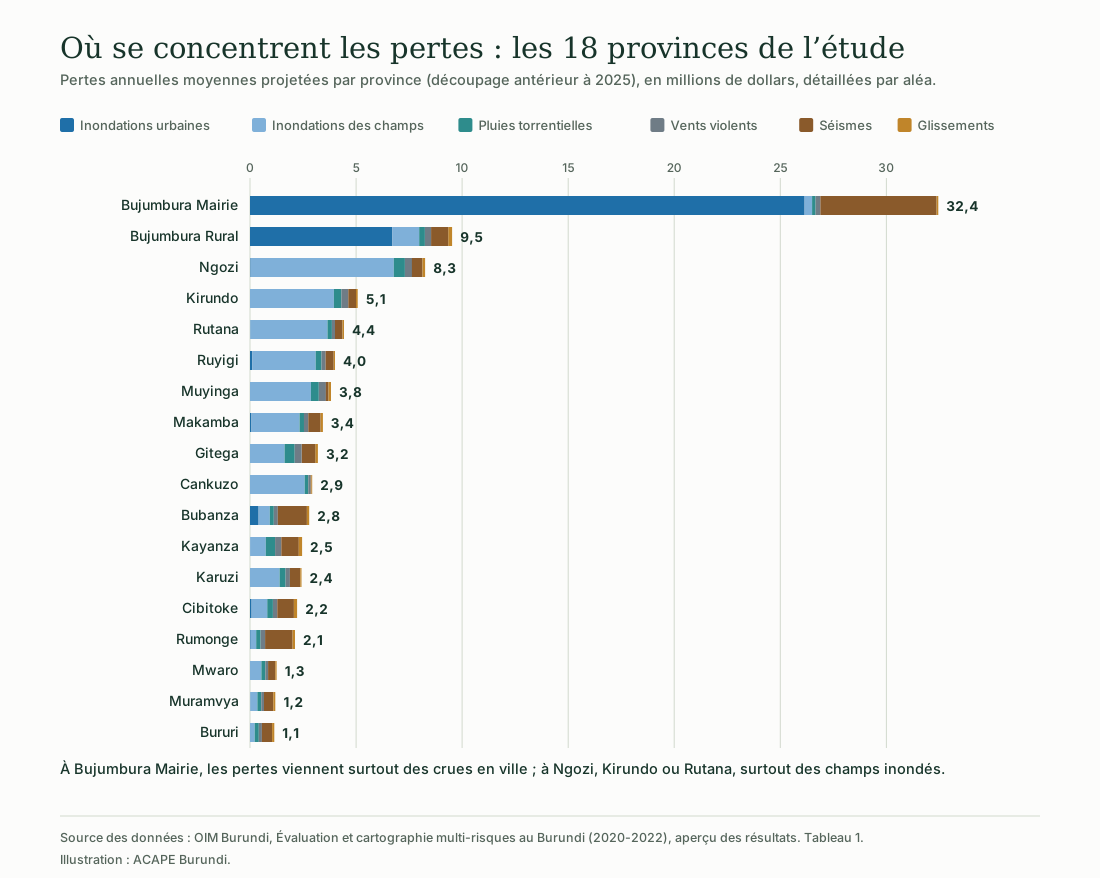
Six original illustrations produced by ACAPE Burundi for the page « Multi-hazard risk analysis of Burundi »: the five hazards mapped, average annual losses by hazard and by province, the ten most exposed communes, the three water levels of Lake Tanganyika, and the grouping of corrective actions. The data come from the multi-hazard risk assessment and mapping carried out for IOM Burundi (2020-2022). These illustrations are free to reuse with acknowledgement of ACAPE Burundi and the sources.